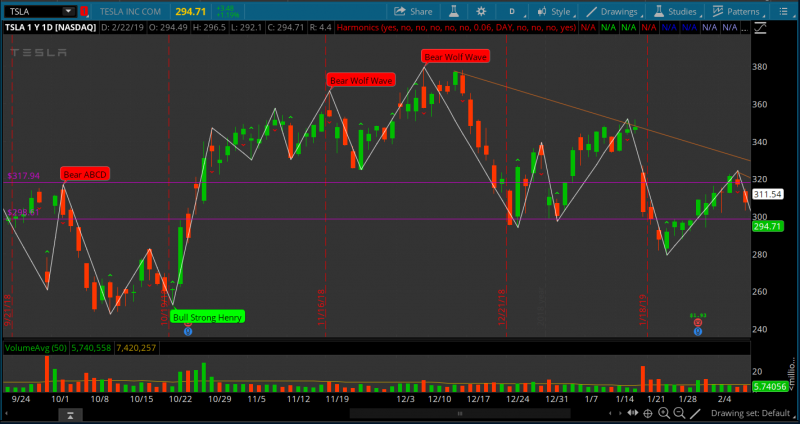
Harmonic Multi Pattern Indicator for ThinkOrSwim TOS

I’ve had success trading your harmonic patterns so far. So far 2-2 for 100 pips. Thanks!
Your gartley indicator is AMAZING! it identified a gartley bull from a few days ago on a position I am currently in… If I had your indicator then, I definitely would have capitalized on that.
I cant wait to play the next wave flagged by your Gartley indicator!
Harmonic Multi-Patterns with Scanner
You like trading. I like making it easier.
I am pleased to announce the new—and very much improved—harmonic multi-pattern indicator with scanner.
The phrase “harmonic trading” and all related pattern names are trademarked by Scott M. Carney and are used with his permission. This indicator is based on information from his book Harmonic Trading: Volume 1. To learn more about harmonic patterns directly from the author, visit his website—HarmonicTrader.com.
I strive to provide clean indicators that are easy to understand. The harmonic multi-pattern indicator does that by combining all detected patterns into one, efficient indicator. You will no longer have to add separate indicators for each pattern you wish to identify. This prevents the pattern overlap that often resulted in a cluttered, confusing chart. Speaking of efficiency, the new algorithm completely eliminates the “too many iterations” error that some have encountered. This will be welcome news to those of you who like to watch the futures or FX market on the smaller intra-day charts.
Multi-Pattern Scan with Custom Watch-list Column

Feature Comparison
Example of Bearish Bat Pattern
Things to notice in the video:
- The pattern is automatically labeled
- Once identified, the ideal pattern completion point is projected via the dashed lines
- The potential reversal zone (PRZ) is highlighted in purple near the ideal completion point
- After price has reached the PRZ, the three, user-configurable, target lines are drawn in purple
Works on Thinkorswim Mobile
Harmonic Trading
Harmonic Trading utilizes the best strategies of Fibonacci and pattern recognition techniques to identify, execute, and manage trade opportunities. These techniques are extremely precise and comprise a system that requires specific conditions to be met before any trade is executed. The Harmonic Trading approach offers information regarding the potential state of future price action like no other technical methods.
The Potential Reversal Zone
This area is marked as a highly probable area for a reversal. This potential reversal zone (PRZ) is marked once point “C” is identified. By calculating the various Fibonacci aspects of a specific price structure, harmonic patterns can indicate a specific area to examine for potential turning points in price action. In the video below, the PRZ is shaded blue and is seen once the butterfly pattern has been identified.


Reviews
There are no reviews yet.